Last week Nick Hillman of Hepi warned that there was ‘a real risk that a university could become insolvent in 2024’. Similar rumours have been doing the rounds for a while now, but I’d not seen the evidence for this. I’m not saying that it doesn’t exist, just that I’d not seen it. So I thought I’d have a look myself, to try and get some objective clarity, using Hesa data.
Hesa – the Higher Education Statistics Agency – is tasked with gathering a range of data on higher education providers in the UK. As well as the usual suspects – the traditional universities and research centres – it includes a range of small, specialist and private providers, including the likes of the Chicken Shed Theatre Company and the Matrix College of Counselling and Psychotherapy Ltd. It’s quite an eye-opener to the 260+ organisations out there that teach students.
The information is impressive and comprehensive, and includes such data as student numbers and courses, institutional income and expenditure, and different categories of staff numbers.
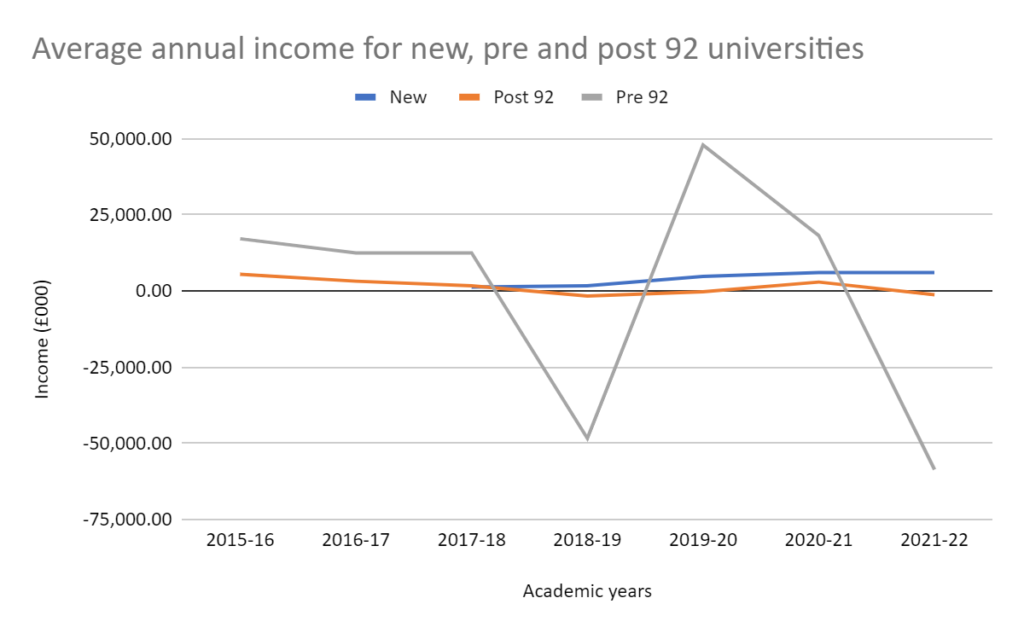
First, I looked at each institution’s deficit or surplus over the last seven years, to identify trends. Alarmingly, in the last year for which data were available, more than half of providers reported a deficit. As there was so much data, I began by grouping the data into different catergories (using average income), starting with pre and post-92, as well as newer providers. The results were startling.

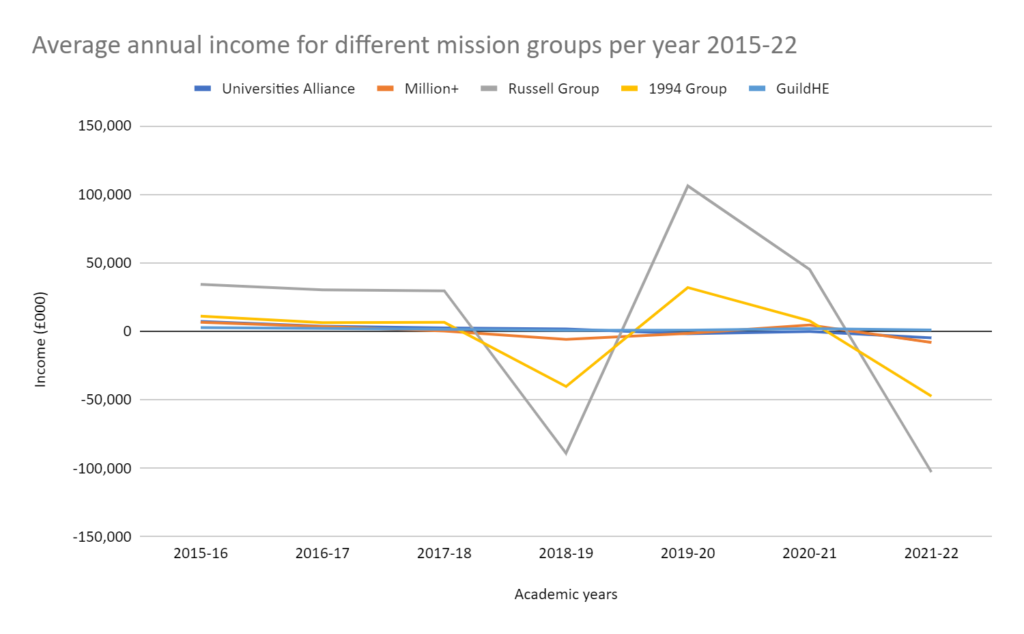
So quite a rollercoaster for pre-92 universities, much less so for post-92s, and relatively steady (and actually upward) for newer, smaller providers. I wanted to see how this broke down further, so divided up the data by mission groups.

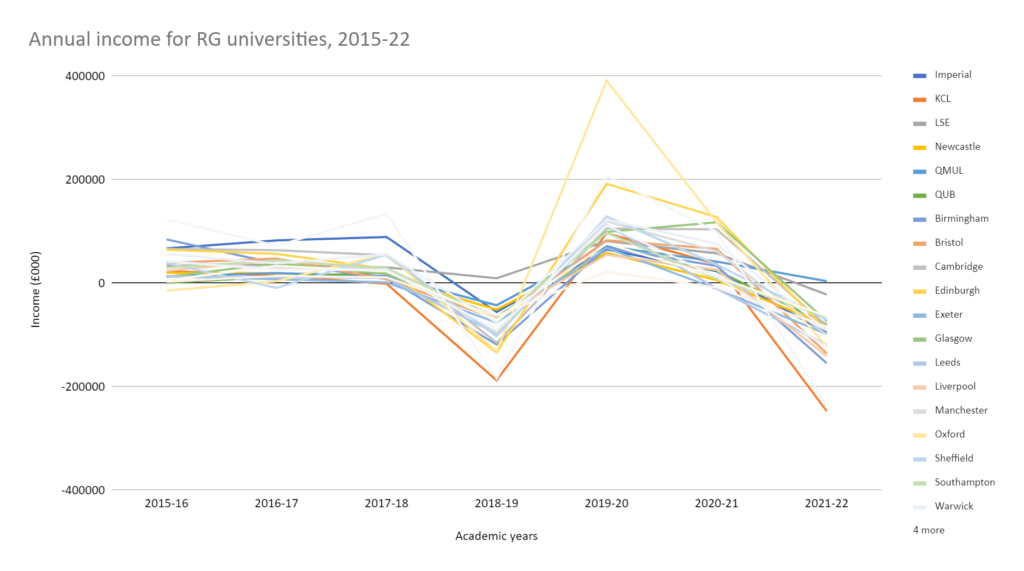
The 24 Russell Group (RG) universities had clearly been particularly affected by recent financial upheavals. There are a number of reasons for this, I believe, the biggest being the revaluation of employer pension contributions in 2018 and 2022. There was also a post-Covid dip between 2019-20 and 2020-21. With the RG representing some of the largest universities in the UK, the effect of these is seen most starkly, with King’s College London reporting an almost quarter-billion pound deficit in 2021-22. Of the 30 universities with the highest deficit in 2021, 21 were RG. The next chart shows how different RG universities have been affected. It’s a difficult chart to read – too many data points – but you get the idea of the way different institutions have performed over the past seven years.

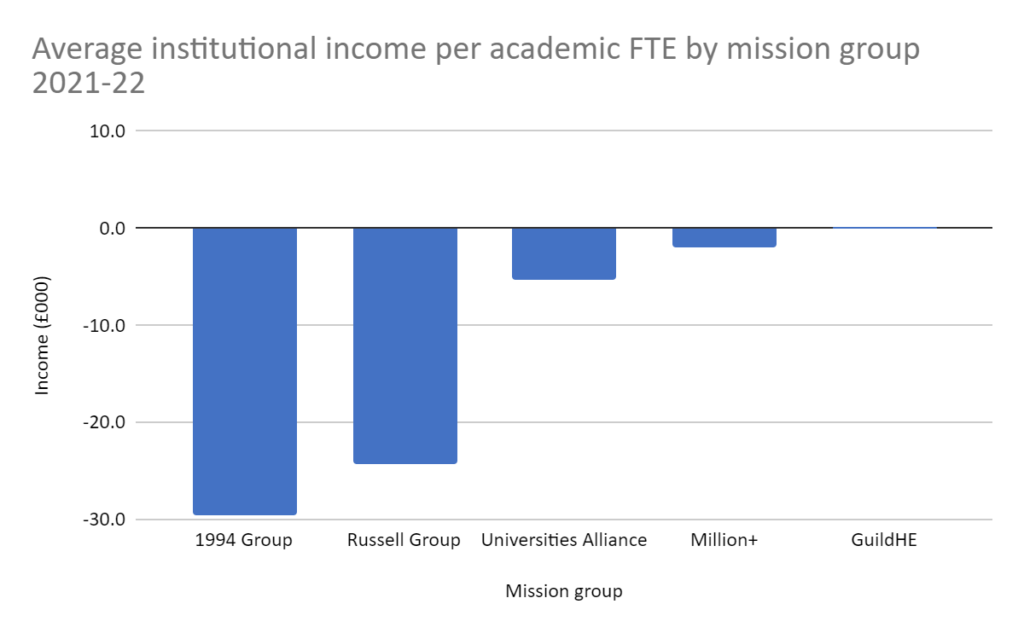
Of course, these were the global totals, but what if we normalise these against FTE? Once again, I grouped the data by mission groups, but did it just for the last year of data available.

This time only seven of the RG universities are in the top 30 list of those with the highest deficit, whereas almost half of the former 1994 Group are in it. These are concerning data for them, as they don’t have the same reserves (and endowments) that most of the RG have. There should be a bounce back in 2022-23, particularly with the revalution of USS in 2023 and reversal of the increase in employer contributions, but increasing operating costs and flatlining tuition fees may mitigate against this. If the bounce back does happen, I hope it will benefit all providers, and not just those that can more easily weather financial storms. If not, Hillman might just be proved right.
Caveat
I’m grateful to Hesa for providing all the data so clearly in all of its downloadable spreadsheets. However, I should make clear that the number-crunching is all mine, and as such the analysis should be taken with caution and readers are encouraged to look further at the underlying data.
Photo by Nicholas Cappello on Unsplash
